PiLog would perform the material criticality or Inventory Analysis in order to determine the criticality, consumption value, consumption rate, stock value, lead time, price of single unit and frequency with which it is used by the plants during the production process.
Inventory management is the ongoing process of moving parts and products into and out of a company’s location(s). Companies manage their inventory on a daily basis as they place new orders for products and ship orders out to customers. It’s important that business leaders gain a firm grasp of everything involved in the inventory management process. That way, they can figure out creative ways to solve inventory management challenges by finding the right solutions.
This module allows the users to easily view inventory movement, usage and trends. Users can analyse inventory sales over a specified time frame and make decisions on how to best adjust item resource planning values based on sales averages and months availability.
The process of understanding the moving parts and products combined with the knowledge of the demand for stock/product. It is the technique to determine the optimum level of inventory for a firm.

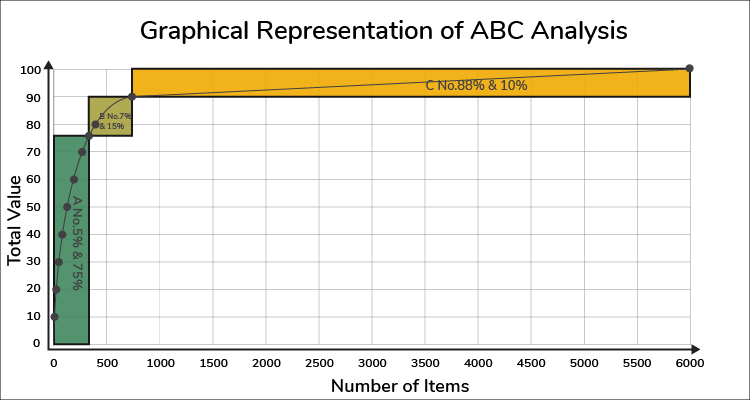
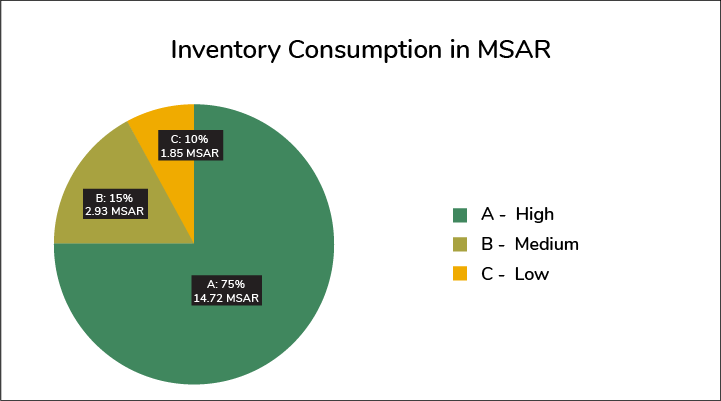
| A | It represents the most valuable products. These are the products that contribute heavily to your overall profit without eating up too much of your resources. This category will be the smallest category reserved exclusively for biggest money makers. It requires tight control | Cumulative percent: 0-75% |
| B | It represents the middle products. These are the products that contribute to the bottom line but aren’t significant enough to receive a lot of attention. It requires moderate control | Cumulative percent: >75-90% |
| C | It represents the hundreds of tiny transactions that are essential for profit but don’t individually contribute much value to the company. This is the category where most of the products will live. It is also the category where we must try to automate sales as much as possible to drive down overhead costs. It requires least control | Cumulative percent: >90-100% |
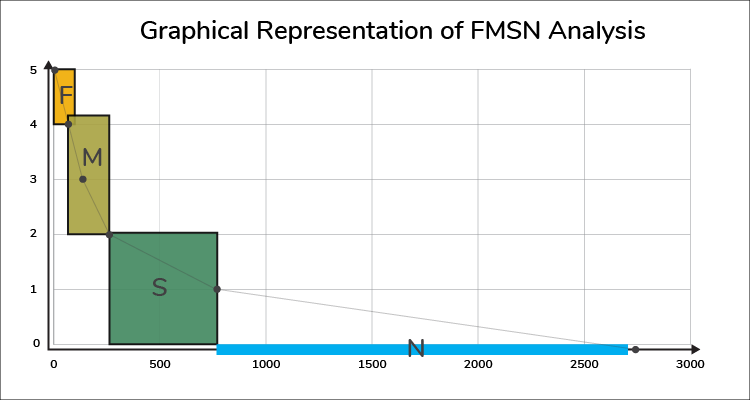
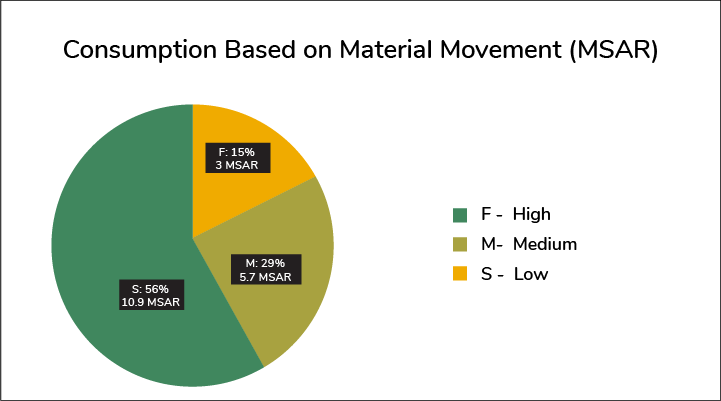
| F | Fast Moving | Items which are issued every year |
| M | Medium Moving | Items which are quarterly issued in a specific time period |
| S | Slow Moving | Items which are less frequently issued and are used once or twice in 5 years |
| N | Non-Moving | Items which are not issued in any year |
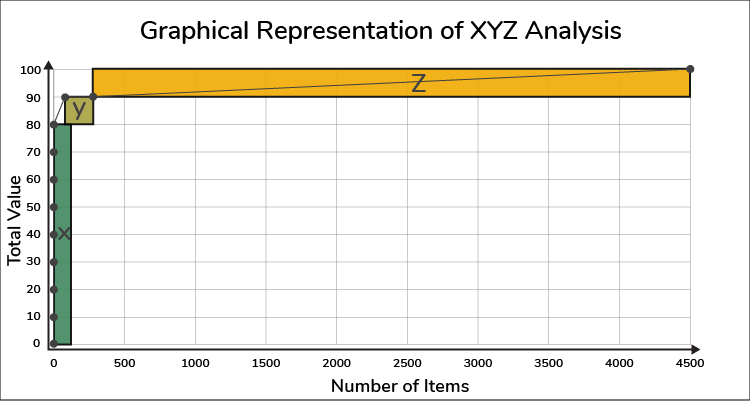
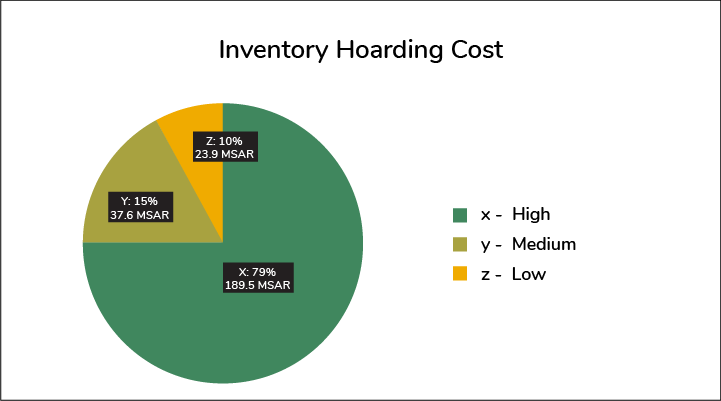
| X | Items which are critically important and require close monitoring and tight control | Cumulative percent: 0-75% |
| Y | Items which are of lower criticality requiring standard controls and periodic reviews of usage | Cumulative percent: >75-90% |
| Z | Items which require least controls, are sometimes issues as "free stock" or forward holding | Cumulative percent: >90-100% |
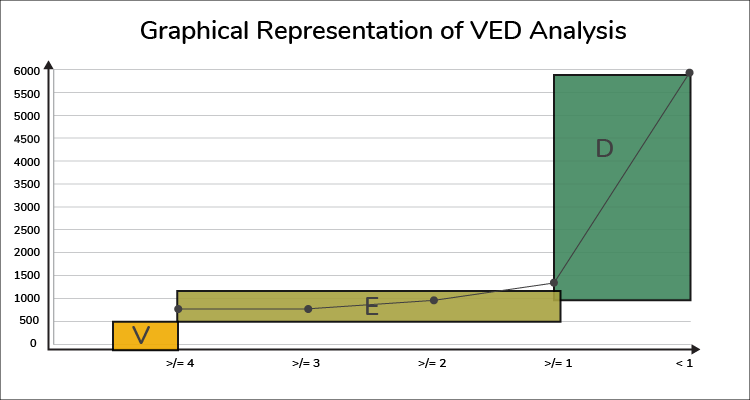
| V-Vital | The spares stock out of which even for a short time will stop production for quite some time & future the cost of stock out is very high | Average Working Hours: >= 4 Hours |
| E-Essential | The spares stock out of which even for a few hours of days & cost of lost production is high | Average Working Hours: >=1, < 4 Hours |
| D-Desirable | The spares which are needed but their absence for even for even a week or so will not lead to stoppage of production | Average Working Hours: < 1 Hour |

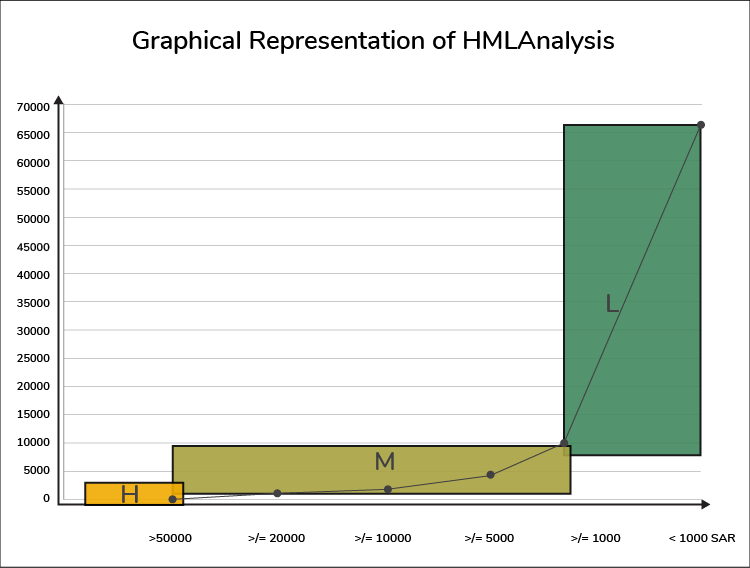
| H | High Cost | These are the costly item and are generally 10-15% of total items | More than 10,000 Rs. |
| M | Medium Cost | These items are low cost item as compared to H class items, this are generally 20-25% of total items | Between 1000-10,000 Rs. |
| L | Low Cost | These items are low class item and generally 60-70% of total items | Less than 1000 Rs. |

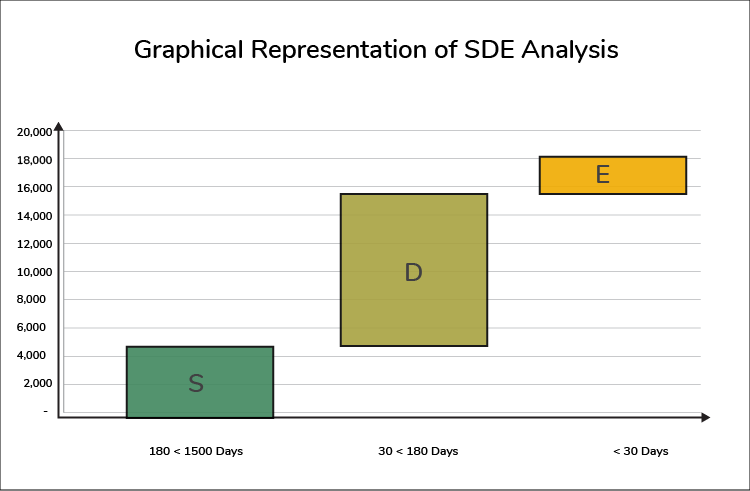
| S | Scarce | Items which are imported and require longer lead time ie., more than 6 months (180+ Days) | Longer Lead Time |
| D | Difficult | Items which require more than a fortnight to be available, but less than 6 months’ lead time (between 1 to 180 Days) | Long Lead Time |
| E | Easy | Items which are easily available in less than a fortnight | Reasonable Lead Time |