Criticality Ranking for Material and Equipment enabling better process control
PiLog would perform the material criticality or Inventory Analysis in order to determine the criticality, consumption value, consumption rate, stock value, lead time, price of single unit & frequency with which it is used by the plants during the production process
Inventory management is the ongoing process of moving parts and products into and out of a company’s location(s). Companies manage their inventory on a daily basis as they place new orders for products and ship orders out to customers. It’s important that business leaders gain a firm grasp of everything involved in the inventory management process. That way, they can figure out creative ways to solve inventory management challenges by finding the right solutions.

This module allows the users to easily view inventory movement, usage and trends. Users can analyse inventory sales over a specified time frame and make decisions on how to best adjust item resource planning values based on sales averages and months availability
The process of understanding the moving parts & products combined with the knowledge of the demand for stock/product. It is the technique to determine the optimum level of inventory for a firm.

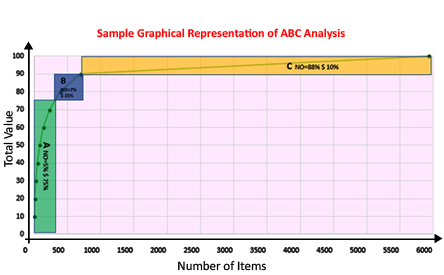
ABC analysis classifies the materials based on their consumption during a particular time period (usually one year)
In day to day warehouse operations, materials are some time under issued, over issued, issued and not accounted into the system, misplaced, etc. This results into inaccuracy in the inventory. Cycle counting is the process to count and reconcile the materials. Ideally, every material in the warehouse should be counted during a fixed interval (every year) for maintaining 100% accuracy, but counting & reconciling every material is not cost effective and very expensive. To count the accuracy of the inventory in a cost-effective manner, it is recommended to count the materials based on inventory classification
| A | Cumulative percent: 0-75% |
| B | Cumulative percent: >75-90% |
| C | Cumulative percent: >90-100% |
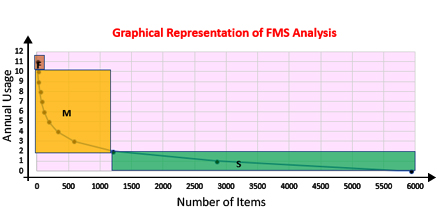
FMS Analysis is based on the rate of issue or rate of usage of spare parts. This classification system categorizes the items based on how frequently the parts are issued and how frequently they are used It helps in the arrangement of stocks in the stores and in determining the distribution and handling patterns. It also helps to avoid investments in non-moving or slow items. It is also useful in facilitating timely control
Usual classification of Items at Inventory can be classified based on the following criteria
| F | Fast Moving |
| M | Medium Moving |
| S | Slow Moving |
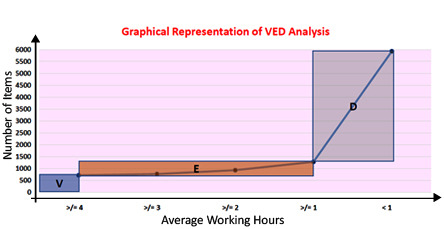
VED analysis classifies the materials according to their criticality and impact to the production process or other services i.e. how and to what extent the material M1 is going to effect the production if the material M1 is not available
It finds out which materials and parts are valuable, which are essential and which are desirable. It is best suited for spares inventory & determine the stocking levels of spare parts
| V-Vital | Average Working Hours: >= 4 Hours |
| E-Essential | Average Working Hours: >=1, < 4 Hours |
| D-Desirable | Average Working Hours: < 1 Hour |
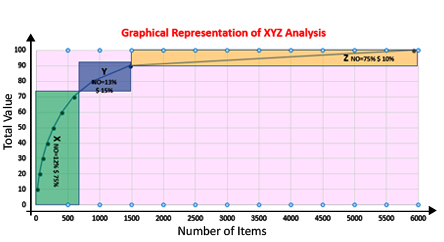
XYZ analysis classifies the materials based on stock value accumulation. It is calculated by dividing an item's current stock value by the total stock value of the stores
It is one of the basic supply chain techniques, often used to determine the inventory valuation inside the stores. It is quite strategic as it can form the basis of various activity including leading plans on alternative stocking arrangements
The items are first sorted on descending order of their current stock value. The values are then accumulated till values reach say 75% of the total stock value. These items are grouped as 'X'. Similarly, other items are grouped as 'Y' and 'Z' items based on their accumulated value reaching another 15% & 10% respectively
The XYZ analysis gives, you an immediate view of which items are expensive to hold. Through this analysis, you can reduce your money locked up by keeping as little as possible of these expensive items
| X | Cumulative percent: 0-75% |
| Y | Cumulative percent: >75-90% |
| Z | Cumulative percent: >90-100% |
HML analysis classifies the materials based on their unit prices. The main objective of this analysis is to minimize the inventory cost such as labour cost, material cost etc.
This analysis is similar to ABC analysis the difference that instant “usage value, price” criteria is used. It is based on Pareto principle or the 80/20 rule. It is used to keep control over consumption at departmental level for deciding the frequency of physical verification
In this analysis cut-off-lines are then fixed by the management of the organization to classify the inventory items. The cut-off-lines are based on unit cost such as
| H | High Cost | These are the costly item and are generally 10-15% of total item | More than 10,000 Rs. |
| M | Medium Cost | These items are low cost item as compared to H class items, this are generally 20-25% of total item | 1000-10,000 Rs. |
| L | Low Cost | These items are low class item and generally 60-70% of total items | Less than 1000 Rs. |
It is very useful in the context of scarcity of supply
SDE analysis classifies inventory based on how freely available an item or scarce an item is, or the length of its lead time. This is how the inventory is classified
It attempts to classify items on the basis of its availability or procurement such as
| S | Scarce | Items which are imported and require longer lead time ie., more than 6 months (180+ Days) | Longer Lead Time |
| D | Difficult | Items which require more than a fortnight to be available, but less than 6 months’ lead time (between 1 to 180 Days) | Long Lead Time |
| E | Easy to acquire | Items which are easily available in less than a fortnight | Reasonable Lead Time |