PiLog Inventory Optimization provides a data-driven framework to balance operational resilience with financial efficiency. By combining advanced criticality scoring (VED/HML) with automated MRP planning, we transform bloated warehouses into streamlined, high-availability supply chains.
Avg. Inventory Reduction
Typical Annual Savings
Service Level Target
Return on Investment
Payback Period
The Business Problem
Industrial enterprises lose millions due to inconsistent equipment identification. Without a unified inventory management framework, data handover between engineering, procurement, and maintenance breaks down, leading to operational delays and maintenance errors.

Excess stock ties up working capital and increases insurance, handling, and obsolescence risks.

Inaccurate criticality rankings mean the wrong parts are in stock, leading to extended production downtime during failures.

Lack of data-driven Re-Order Points (ROP)leads to emergency spot-buys and high freight premiums.
The PiLog Solution
The PiLog framework utilizes six-dimensional analysis to ensure every SKU has a scientifically determined stocking strategy

Multi-Dimensional Analysis. We apply ABC (Value), FSN (Flow), XYZ (Stock Accumulation), and VED (Criticality) to categorize every material.

Criticality Scoring. Our MCA/MCR tool generates a composite score based on production impact, lead time, and safety risk.

Planning Parameters. The system automatically calculates Economic Order Quantity (EOQ), Safety Stock (SS), and Min/Max levels to align with actual deman
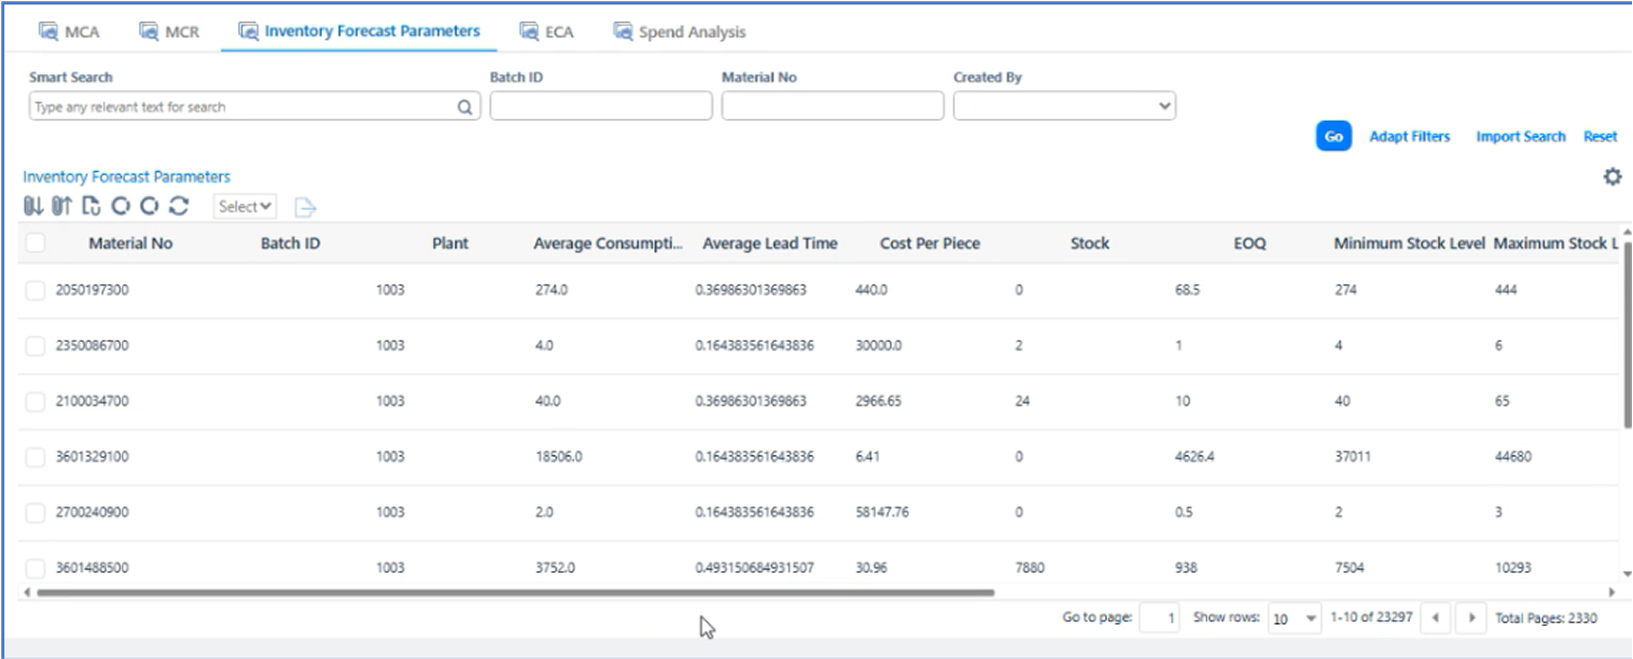
Monitor consumption rates and lead times to dynamically adjust levels & prevent obsolescence.
Apply statistical formulas to define ROP and Safety Stock based on lead-time variability.
Inventory Categorization Segment stock using HML (Unit Cost) and SDE (Sourcing Ease) to determine procurement strategies.
Evaluate materials based on Production Impact, Sourcing Difficulty, and Safety Risks.
Cleanse and standardize raw material data to ensure accurate "Inputs" for the analysis engine.
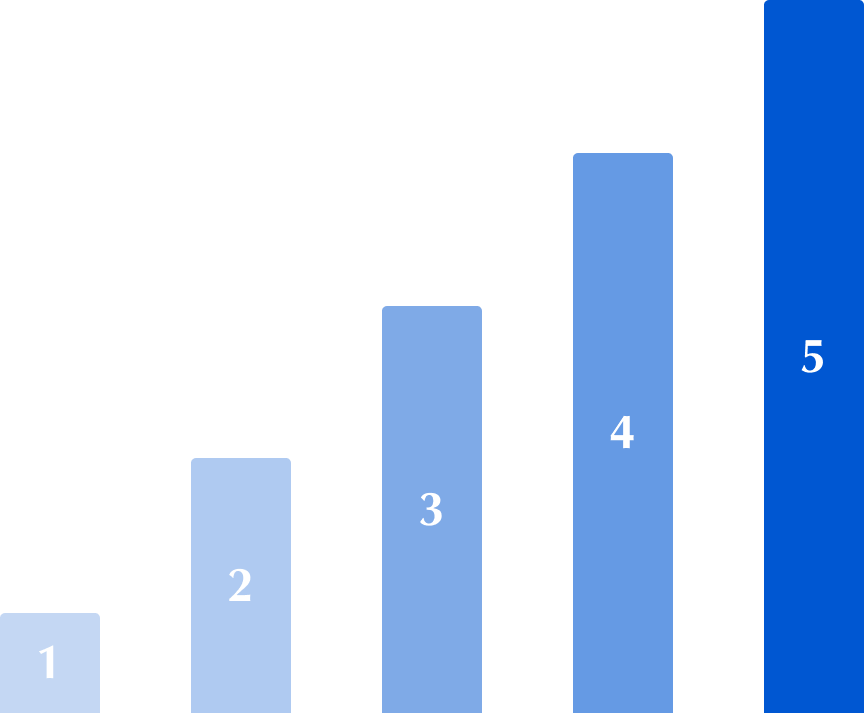
Proprietary engine for ranking material criticality and production impact scores.
| Material | Criticality Score | Impact | MCR Score | ||
|---|---|---|---|---|---|
| Supply Impact | Profit Impact | Production Impact | |||
| 1500111257 | >=18 | 3 (High) | |||
| 1500092819 | 13-18 | 2 (Medium) | |||
| 1500092923 | <=13 | 1 (Low) | |||
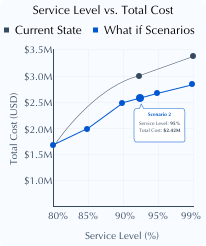
Dashboard for simulating "What-If" scenarios on stock levels vs. service goals
Scenario 2
Best balance of service and cost
Direct integration with ERP to trigger procurement based on calculated ROP/EOQ.

Demand & Inventory Data

Calculate ROP/EOQ

Auto-generate PR/PO

Sent Supplier
Join the organizations using PiLog Inventory Optimization to reduce excess stock by 30% while improving service levels.